Custom Monitors
How to create and use Custom Monitors in Revefi
Custom monitors allow you go beyond the automatic metadata only access monitors automatically created by Revefi and create your own as necessary. In order to create a custom monitor, SELECT access must be granted to the Revefi role for the table to be monitored.
Note: Revefi only stores the numeric result of the query and does not pull back or store any data from the data source.
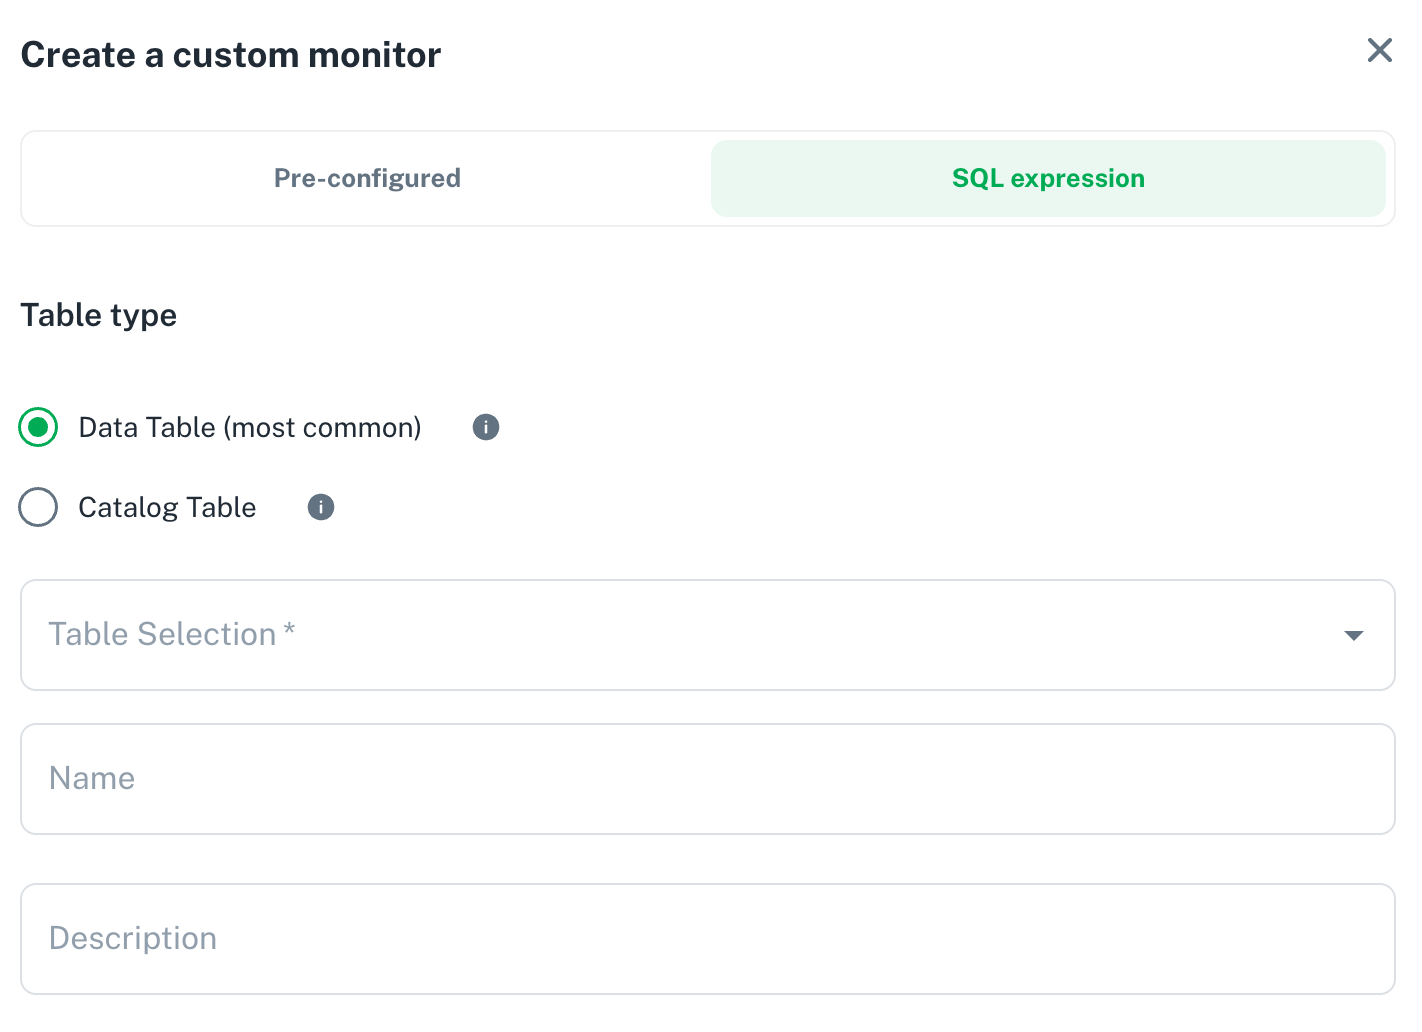
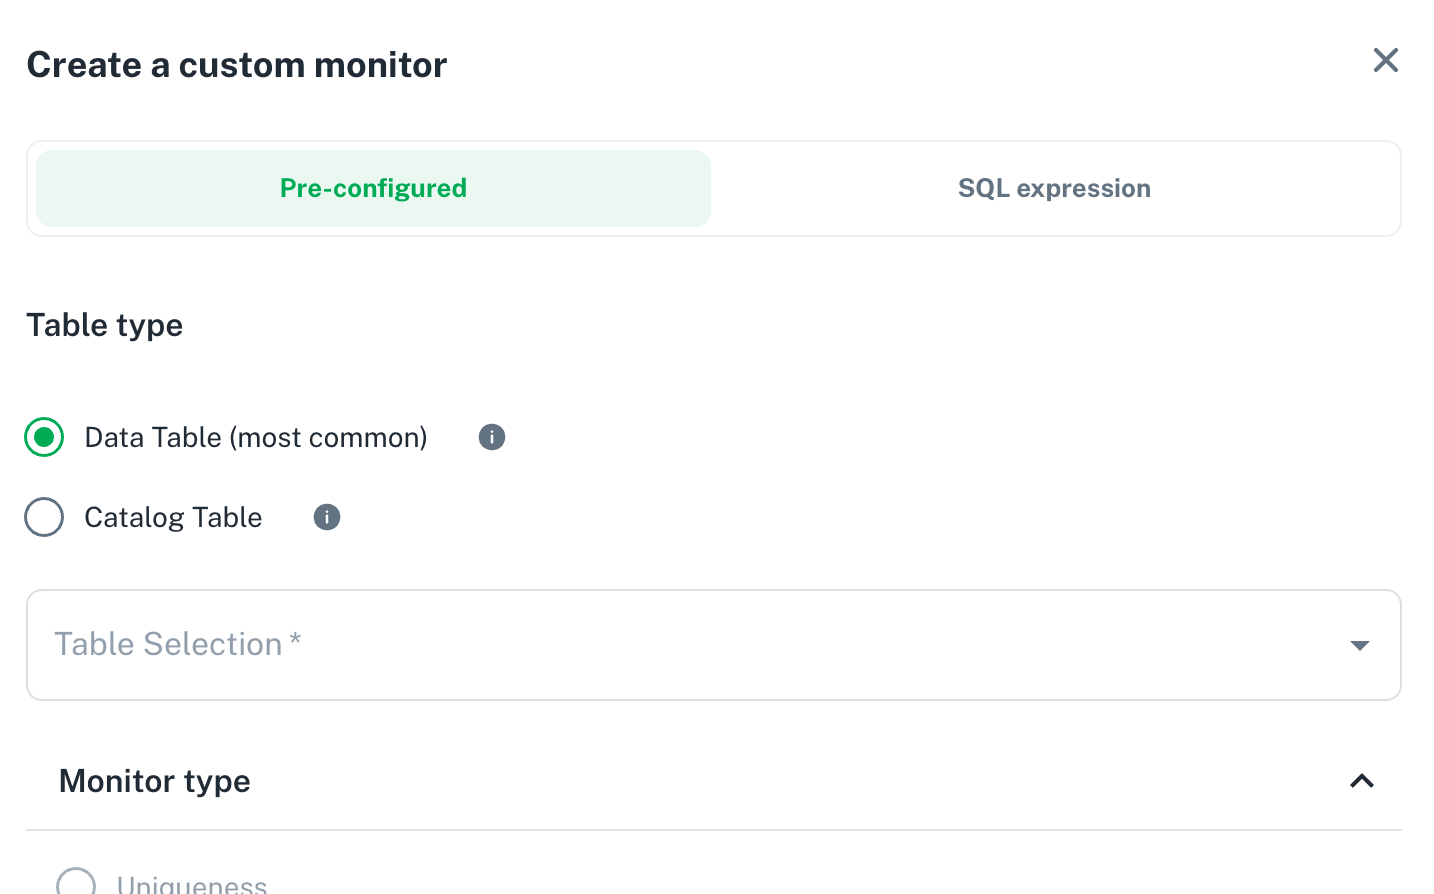
Revefi supports Pre-built and Custom SQL custom monitors at the Data Table level and Catalog Table level.
- Catalog Table options are specific to the Data Source. Catalog table is a table with metadata about your database, its structure, and usage statistics E.g. Query_History, Warehouse_Credits.
- Data table is a table you use for your business or operational purposes. E.g. Revenue, Orders, Customers.
Revefi provides zero-touch monitoring out of the box for these, but you are welcome to create custom monitors here for your specialized needs!
There are two ways to create a Custom Monitor:
- From the Table Dashboard page, click the Create Monitor button in the upper right hand corner to create a custom monitor for that table. The table is pre-selected in the form. (Catalog Table is not available at this level)
- From the Monitors tab, click the Create Monitor button in the upper right hand corner to create a custom monitor for a table. You will need to select the table
For SQL monitors, a name and description should be specified.

You will need to enter the SQL you wish to run and ensure it is correct. A numeric return value is required.

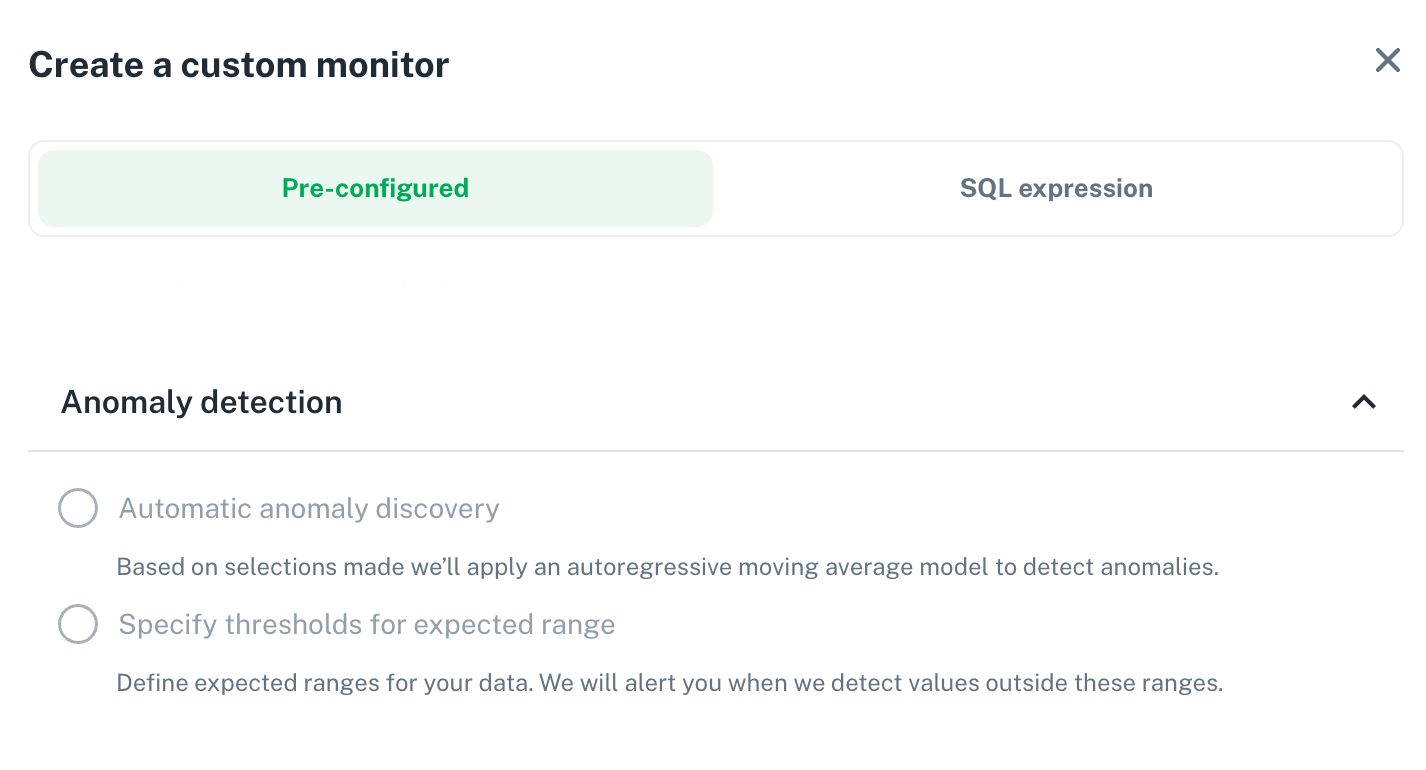
Anomaly Detection
For either monitor type, you can select the anomaly detection type:
Automatic anomaly discovery - Based on selections made we’ll apply an autoregressive moving average model to detect anomalies. Specify thresholds for expected range - Define expected ranges for your data. We will alert you when we detect values outside these ranges. Multiple thresholds are allowed.

Thresholds can be:
- Numeric
- % Last Value
- % Avg
- Times Standard Deviation
Conditions can be:
- Less than
- Less than or equal to
- Equal to
- Greater than
- Greater than or equal to
- Between
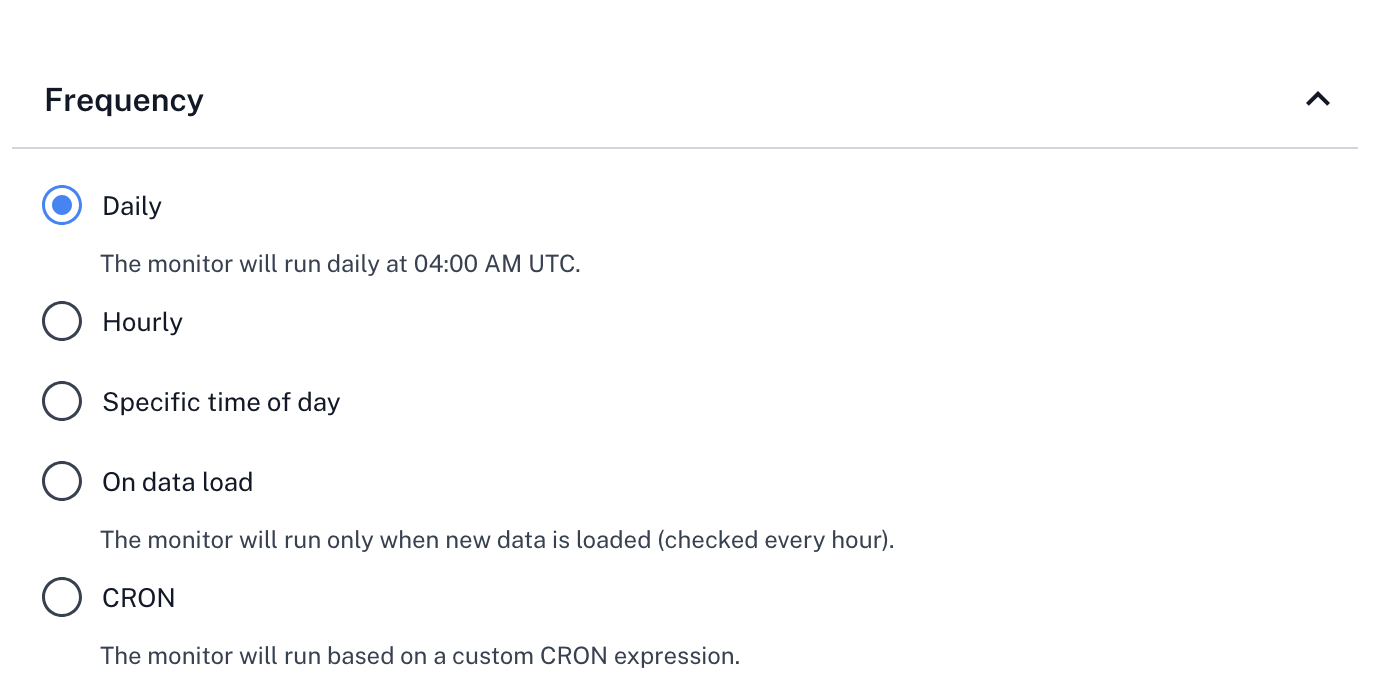
Frequency
Revefi allows you a varity of options to schedule the run custom monitor

Select the run frequency based on your requirements
Test Your Monitor
To test your monitor access and correctness, click the Preview Results button to run the monitor and receive query results. To create the monitor, click Create Monitor. The monitor will appear in the monitors tab and on the appropriate Table Dashboard page and will start collecting data and generating alerts as appropriate.

Note: Alerts are fired immediately for Custom monitors.
Updated 2 months ago
