
Track Data Product Cost and Adoption
Use Schema Spend to measure what each data product costs to run in Snowflake and how actively it is used.
Many data teams publish each data product, domain, or team's work into its own Snowflake schema. Snowflake bills by warehouse, not by schema, so it is hard to answer two basic questions about any single data product: what does it cost to run, and is anyone using it?
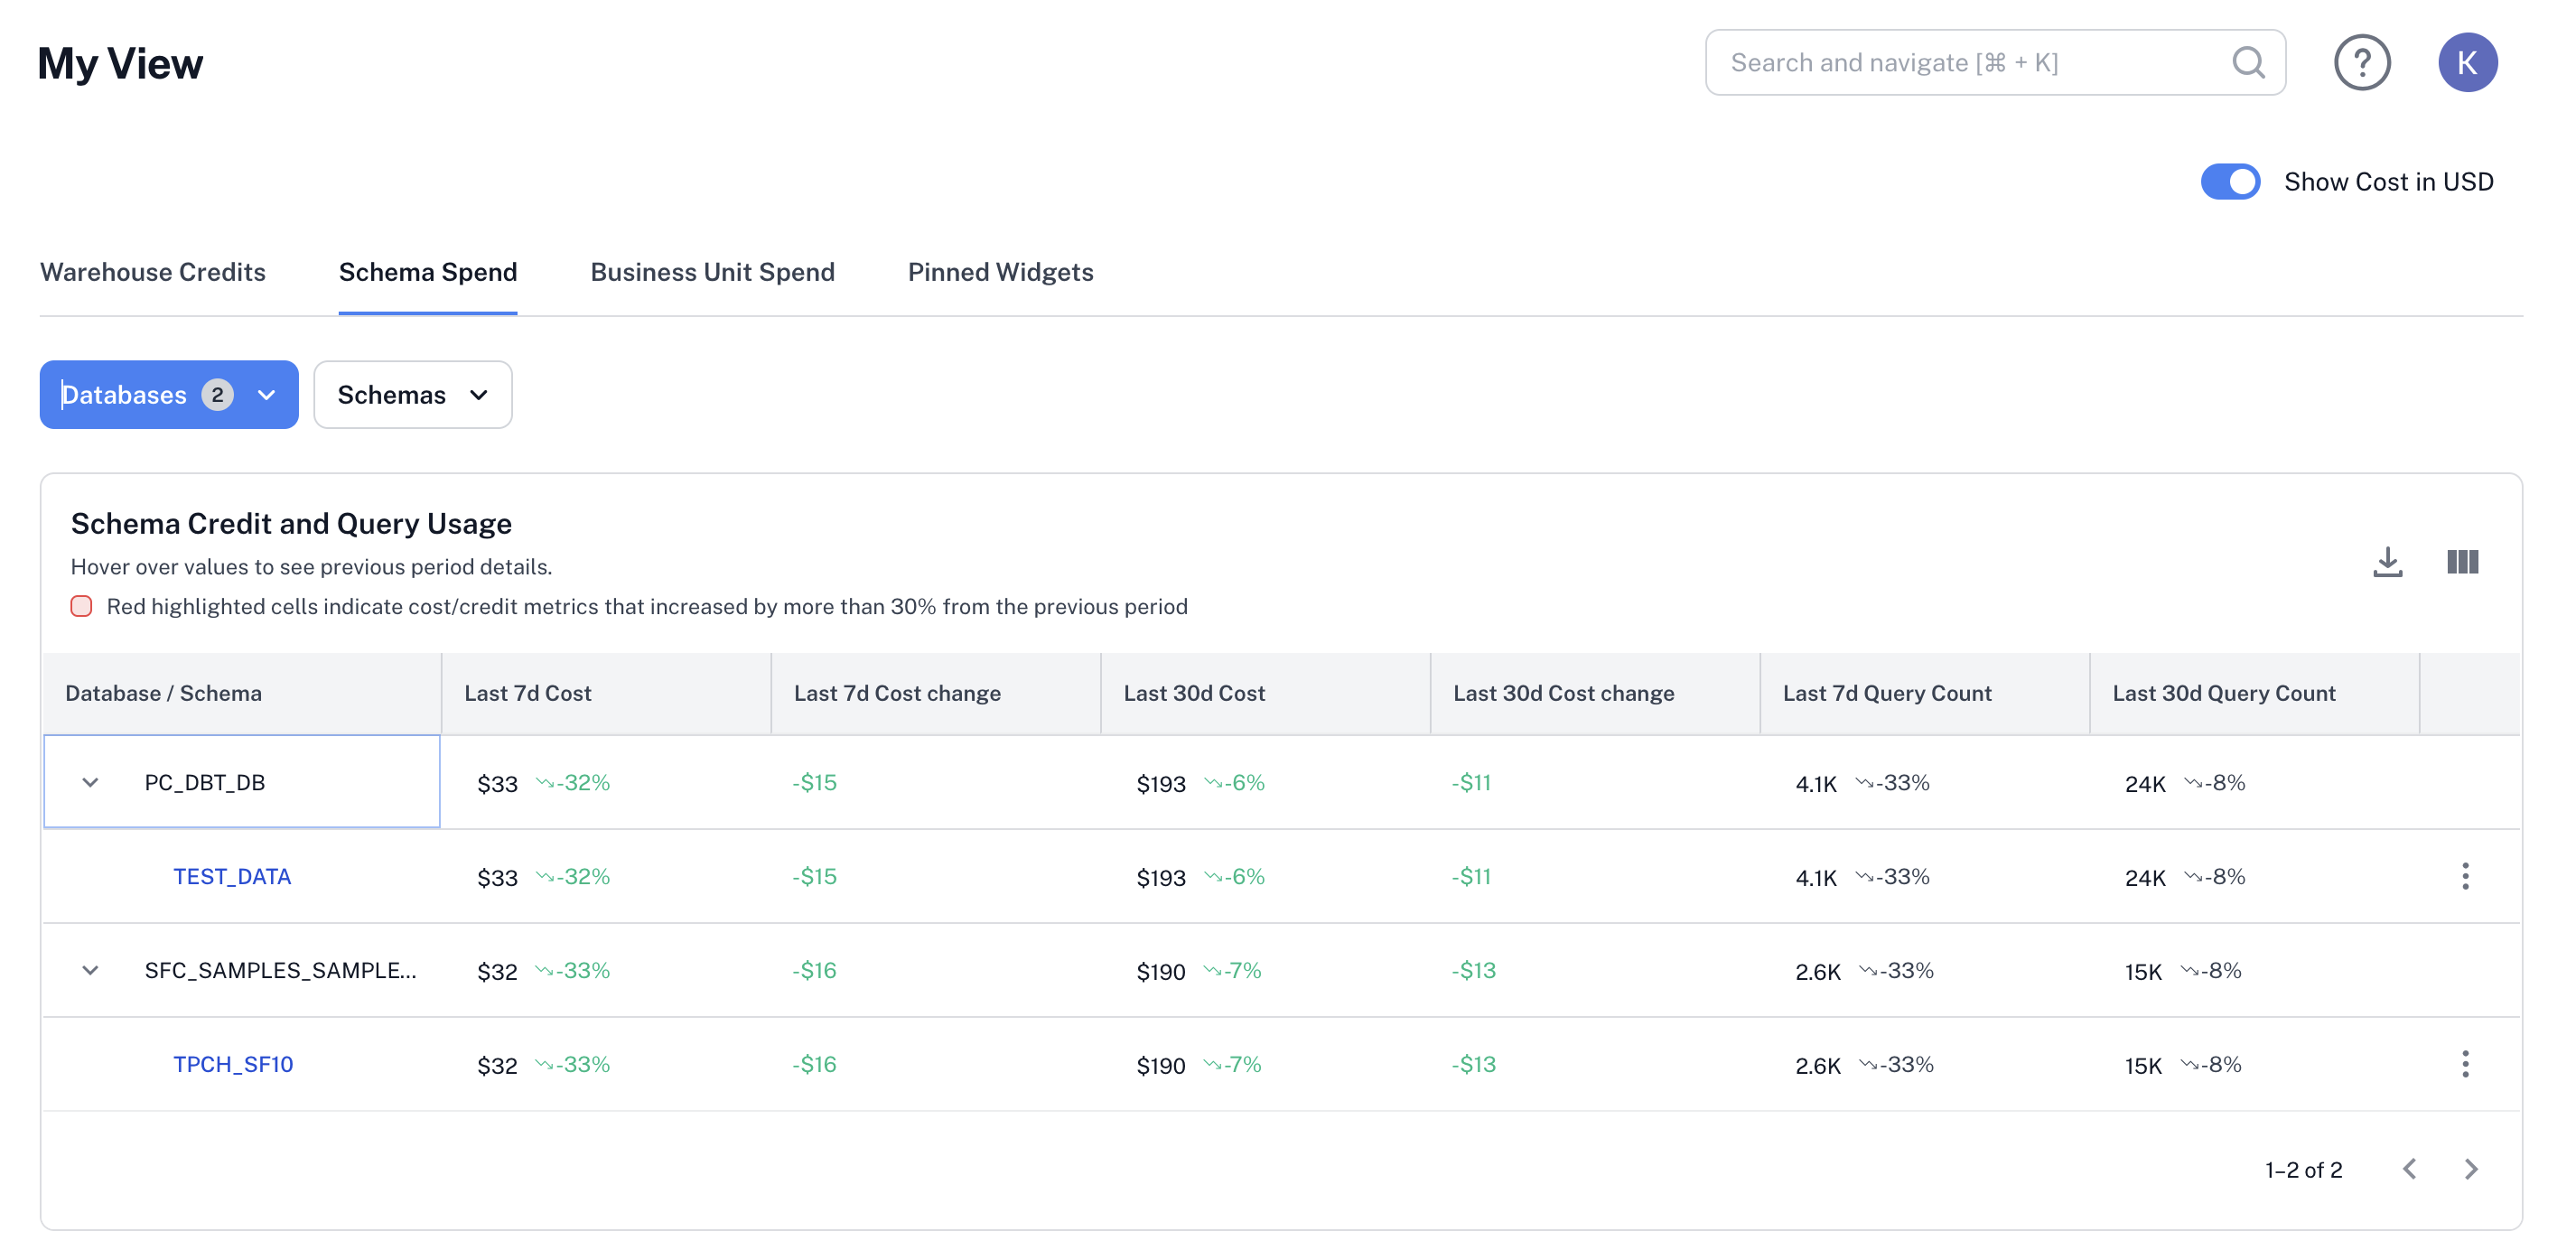
Revefi's Schema Spend view answers both. It tracks Snowflake cost and query activity at the database and schema level, with rolling 7-day and 30-day snapshots and monthly or weekly trends in table or chart view. When schemas map to data products, this gives every product owner a clear picture of cost and adoption.
This page describes the problems data teams solve with Schema Spend.
Who this is for
- Data product owners who need to know what their product costs to run and whether consumers are using it.
- Data platform and data engineering leads who manage Snowflake spend across many schemas and need to find where cost is growing and why.
- Analytics engineers who build and maintain dbt models and want to see the cost impact of their changes.
- FinOps and cloud cost analysts who allocate Snowflake spend to teams, track it against budget, and forecast future costs.
- Heads of data and data leaders who report on the cost and value of the data platform to executives.
- Business unit and domain leaders who receive showback or chargeback reports and want to understand the spend attributed to their teams.
Understand the cost and adoption of each data product
The problem
In a data mesh or data product model, product owners can't easily see what their product costs to run or how heavily it is consumed.
How Schema Spend helps
Each schema shows its own cost and query count. A product owner can filter to their schema and see:
- Cost: Last 7d and Last 30d cost, the change in dollars and percent, and the monthly trend.
- Adoption: Last 7d and Last 30d query count, plus the monthly or weekly trend, as a measure of how actively the product is consumed.
Viewing cost and adoption together shows whether a product's spend is justified by its usage.
Outcome
Each data product has a measurable cost of ownership and adoption signal. Owners can report on it, defend it, or improve it.
Measure cost efficiency (cost per query)
The problem
A rising bill isn't necessarily a problem if usage is rising with it. What matters is whether each unit of usage is getting more expensive.
How Schema Spend helps
Dividing cost by query count for the same period gives an approximate cost per query for each schema. Compare it month over month:
- Cost and queries move together: spend is tracking demand, which is healthy.
- Cost rises while queries stay flat: each query is getting more expensive. Common causes are inefficient queries, growing data volumes, a warehouse that was sized up, or reduced pruning.
- Cost falls sharply while queries stay flat: something changed in how the workload runs. Confirm the change was intentional.
Example
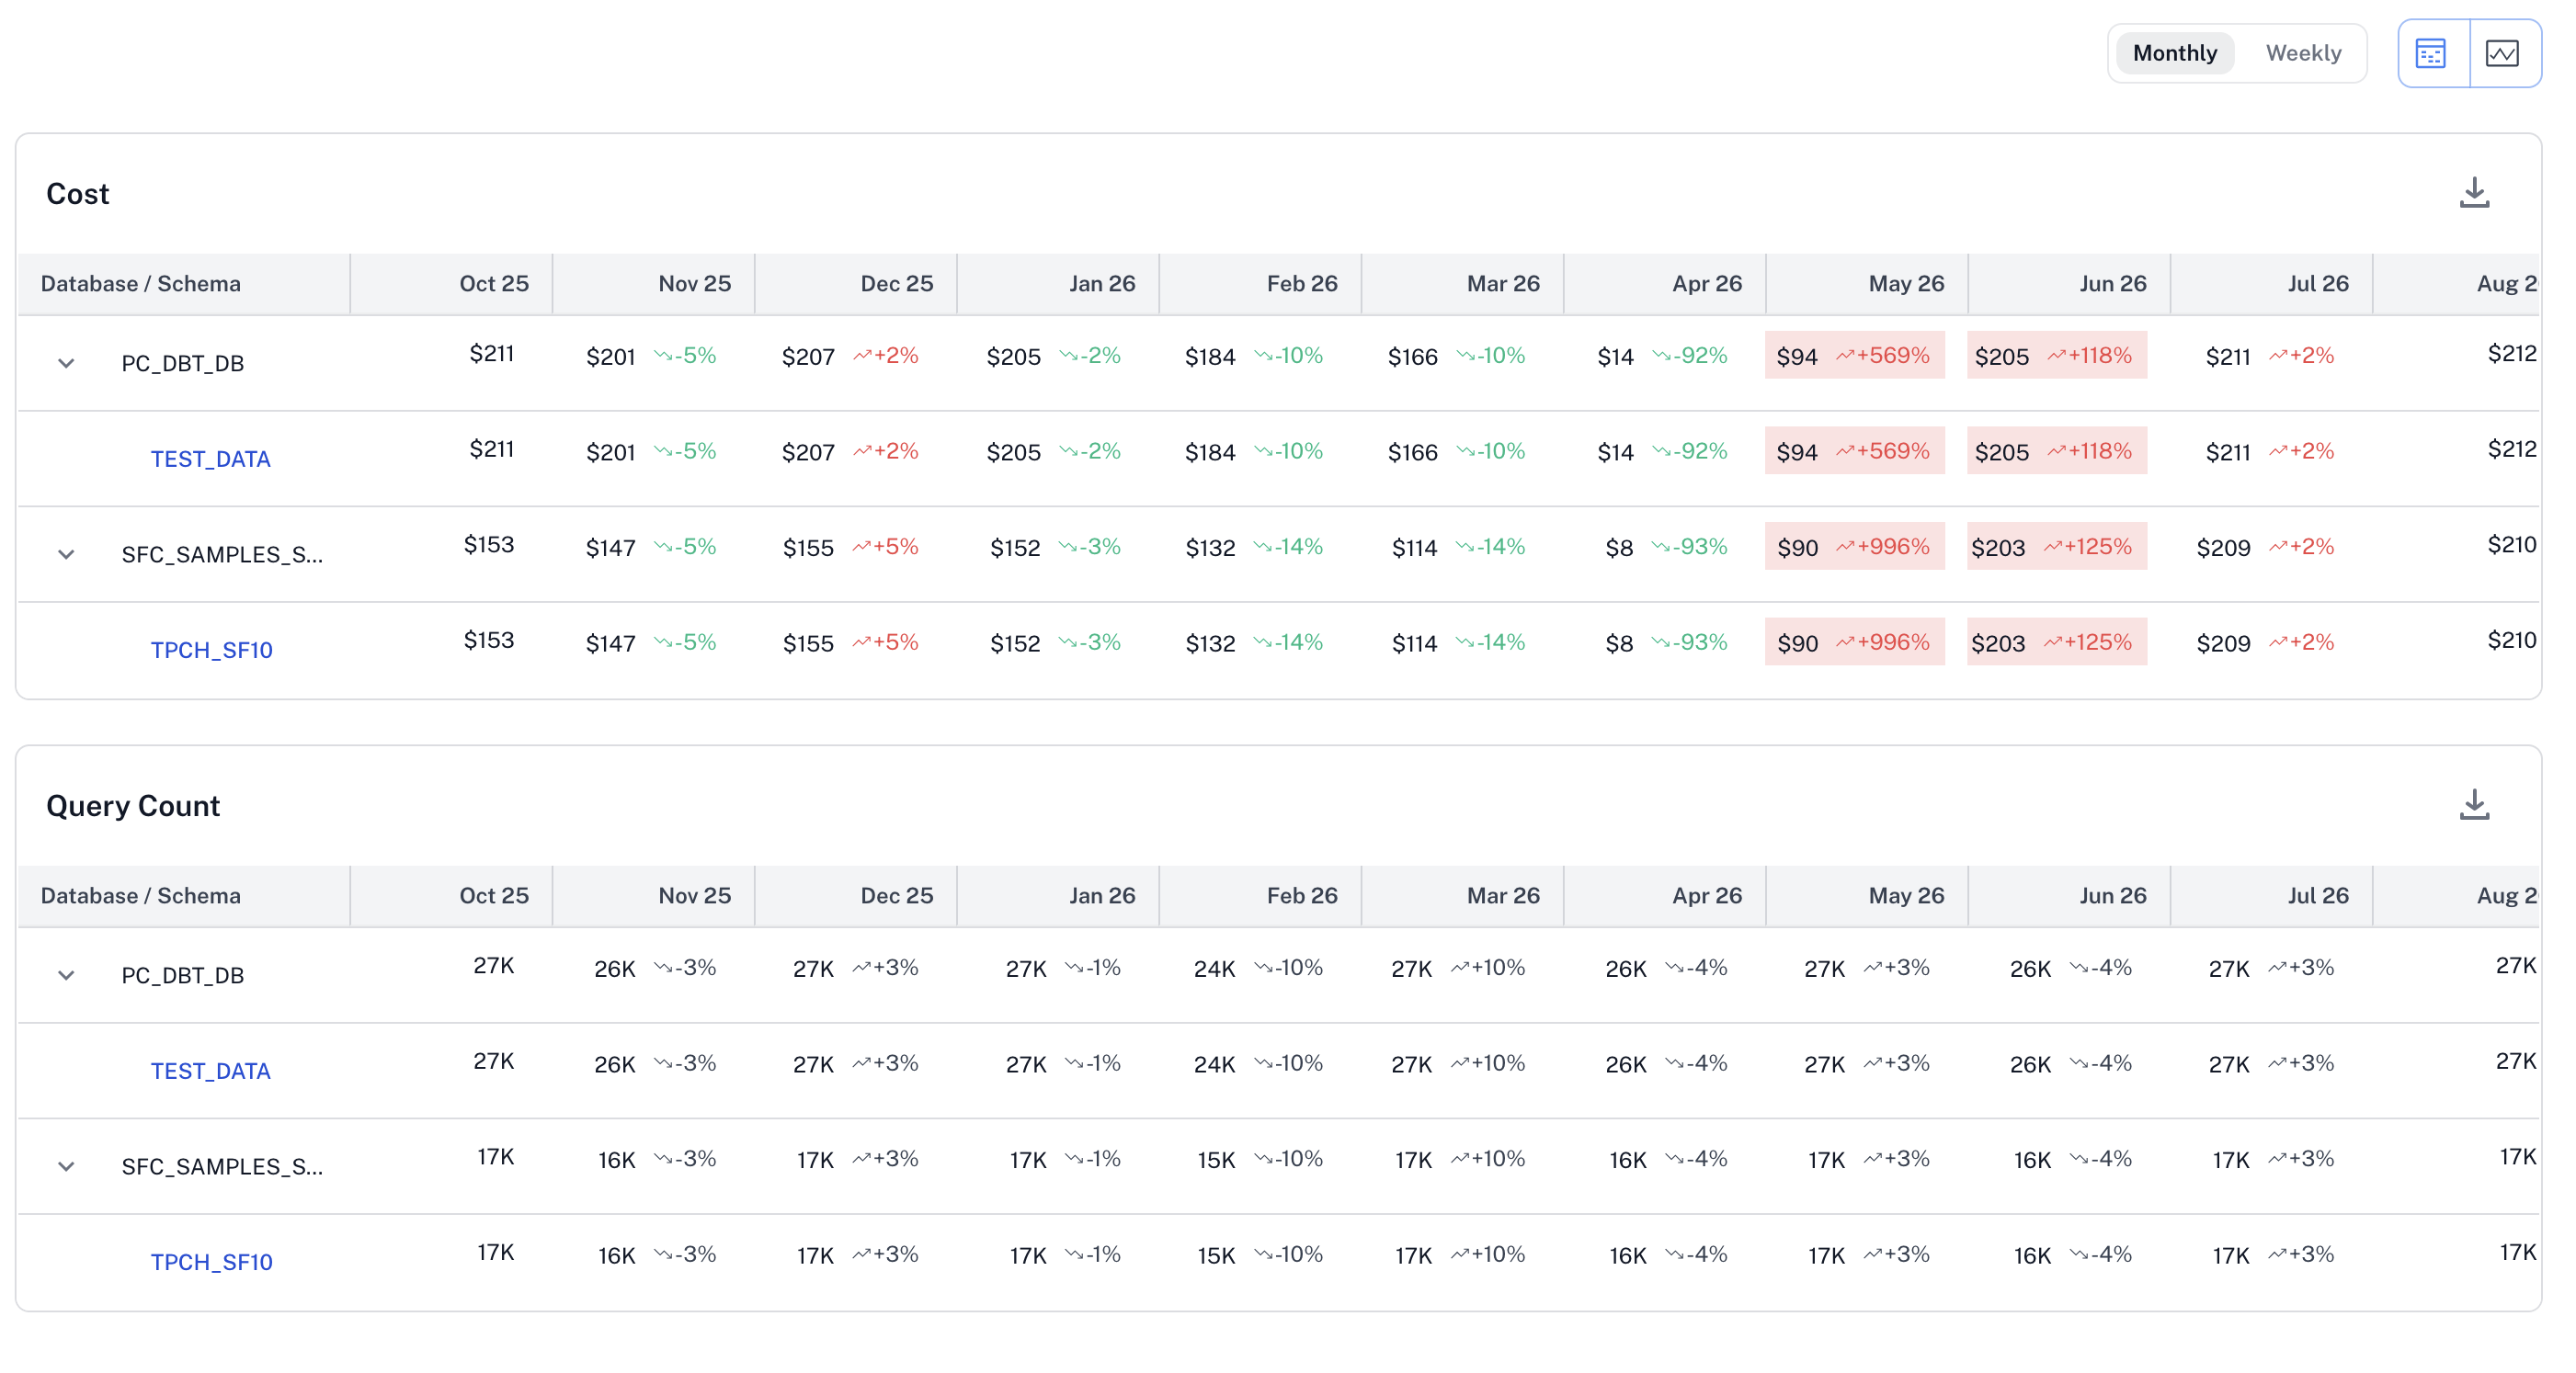
A schema runs about 26–27K queries every month at a steady cost of around $200. One month its cost drops to $14 (−92%) while queries fall only 4%, and the following month cost jumps +569%. Because query volume held steady, the swing came from how the workload was executed, not from how much it was used. That is the signal to investigate warehouse configuration, scheduling, or data collection for that period.
Outcome
Teams can tell growth-driven cost increases apart from efficiency regressions and focus optimization work where it matters.
Catch cost spikes early
The problem
A misconfigured job, a runaway model, or a new heavy consumer can quietly inflate a schema's cost for weeks before anyone looks at the bill.
How Schema Spend helps
Cost and credit metrics that increase by more than 30% over the previous period are highlighted in red. Hover over a value to see the previous period's details. Switch to the Weekly view to narrow down when a spike started, then match it against deployments, new dbt models, or new users.
Outcome
Problems are found in days instead of at month-end invoice review, and investigations start with a specific time window and schema.
Identify candidates for deprecation
The problem
Data platforms accumulate schemas and products that keep running pipelines and consuming credits long after people stop using them.
How Schema Spend helps
Compare schemas by cost and query count to find products with meaningful spend and low or declining queries. A steady downward trend in the monthly Query Count view is a strong early signal.
Outcome
Teams reclaim spend by retiring or consolidating low-value products, backed by usage evidence to share with stakeholders before sunsetting anything.
Show back or charge back costs to domains and business units
The problem
Central data platform teams absorb the whole Snowflake bill, which gives consuming teams little incentive to manage their usage.
How Schema Spend helps
When schemas map to teams or domains, schema-level cost becomes a natural allocation unit. Download the Cost and Query Count tables as CSV for finance reporting, and use the Business Unit Spend view for a rolled-up picture. The Show Cost in USD toggle lets you report in dollars for finance audiences or in credits for platform engineers.
Outcome
Cost accountability moves to the teams that generate it, which encourages better usage habits without heavy-handed controls.
Verify the impact of optimization work
The problem
After a team rewrites models, changes clustering, or resizes a warehouse, it needs proof that the change lowered cost without hurting usage.
How Schema Spend helps
Use the Weekly view to compare the weeks before and after a change. A successful optimization shows lower cost with stable query counts. Lower cost combined with a drop in queries may mean consumers were affected.
Outcome
Teams can quantify the savings from engineering work and report them.
Plan budgets and forecast spend
The problem
Planning next quarter's Snowflake budget from a single account-level number hides which products are driving growth.
How Schema Spend helps
Monthly trends per schema show which data products are growing, flat, or shrinking. Use them to forecast spend per product and to plan capacity for products whose adoption is climbing.
Outcome
Budgets are built from the bottom up, per product, with clear drivers behind each number.
Report to leadership on a regular cadence
The problem
Data leaders need a repeatable way to show platform spend, adoption, and efficiency trends in monthly or quarterly business reviews.
How Schema Spend helps
Add Schema Spend widgets to Pinned Widgets for a standing dashboard. Switch to chart view for trend visuals, and download the tables for slides or spreadsheets.
Outcome
Consistent, low-effort reporting on the cost and value of the data platform.
Get started
- Go to My View → Schema Spend.
- Use the Databases and Schemas filters to select the data products you want to monitor.
- Review the Schema Credit and Query Usage table for the rolling 7-day and 30-day snapshot.
- Switch between Monthly and Weekly to view trends, and between table and chart views.
- Download the data or pin widgets for recurring reporting.
Updated 21 days ago